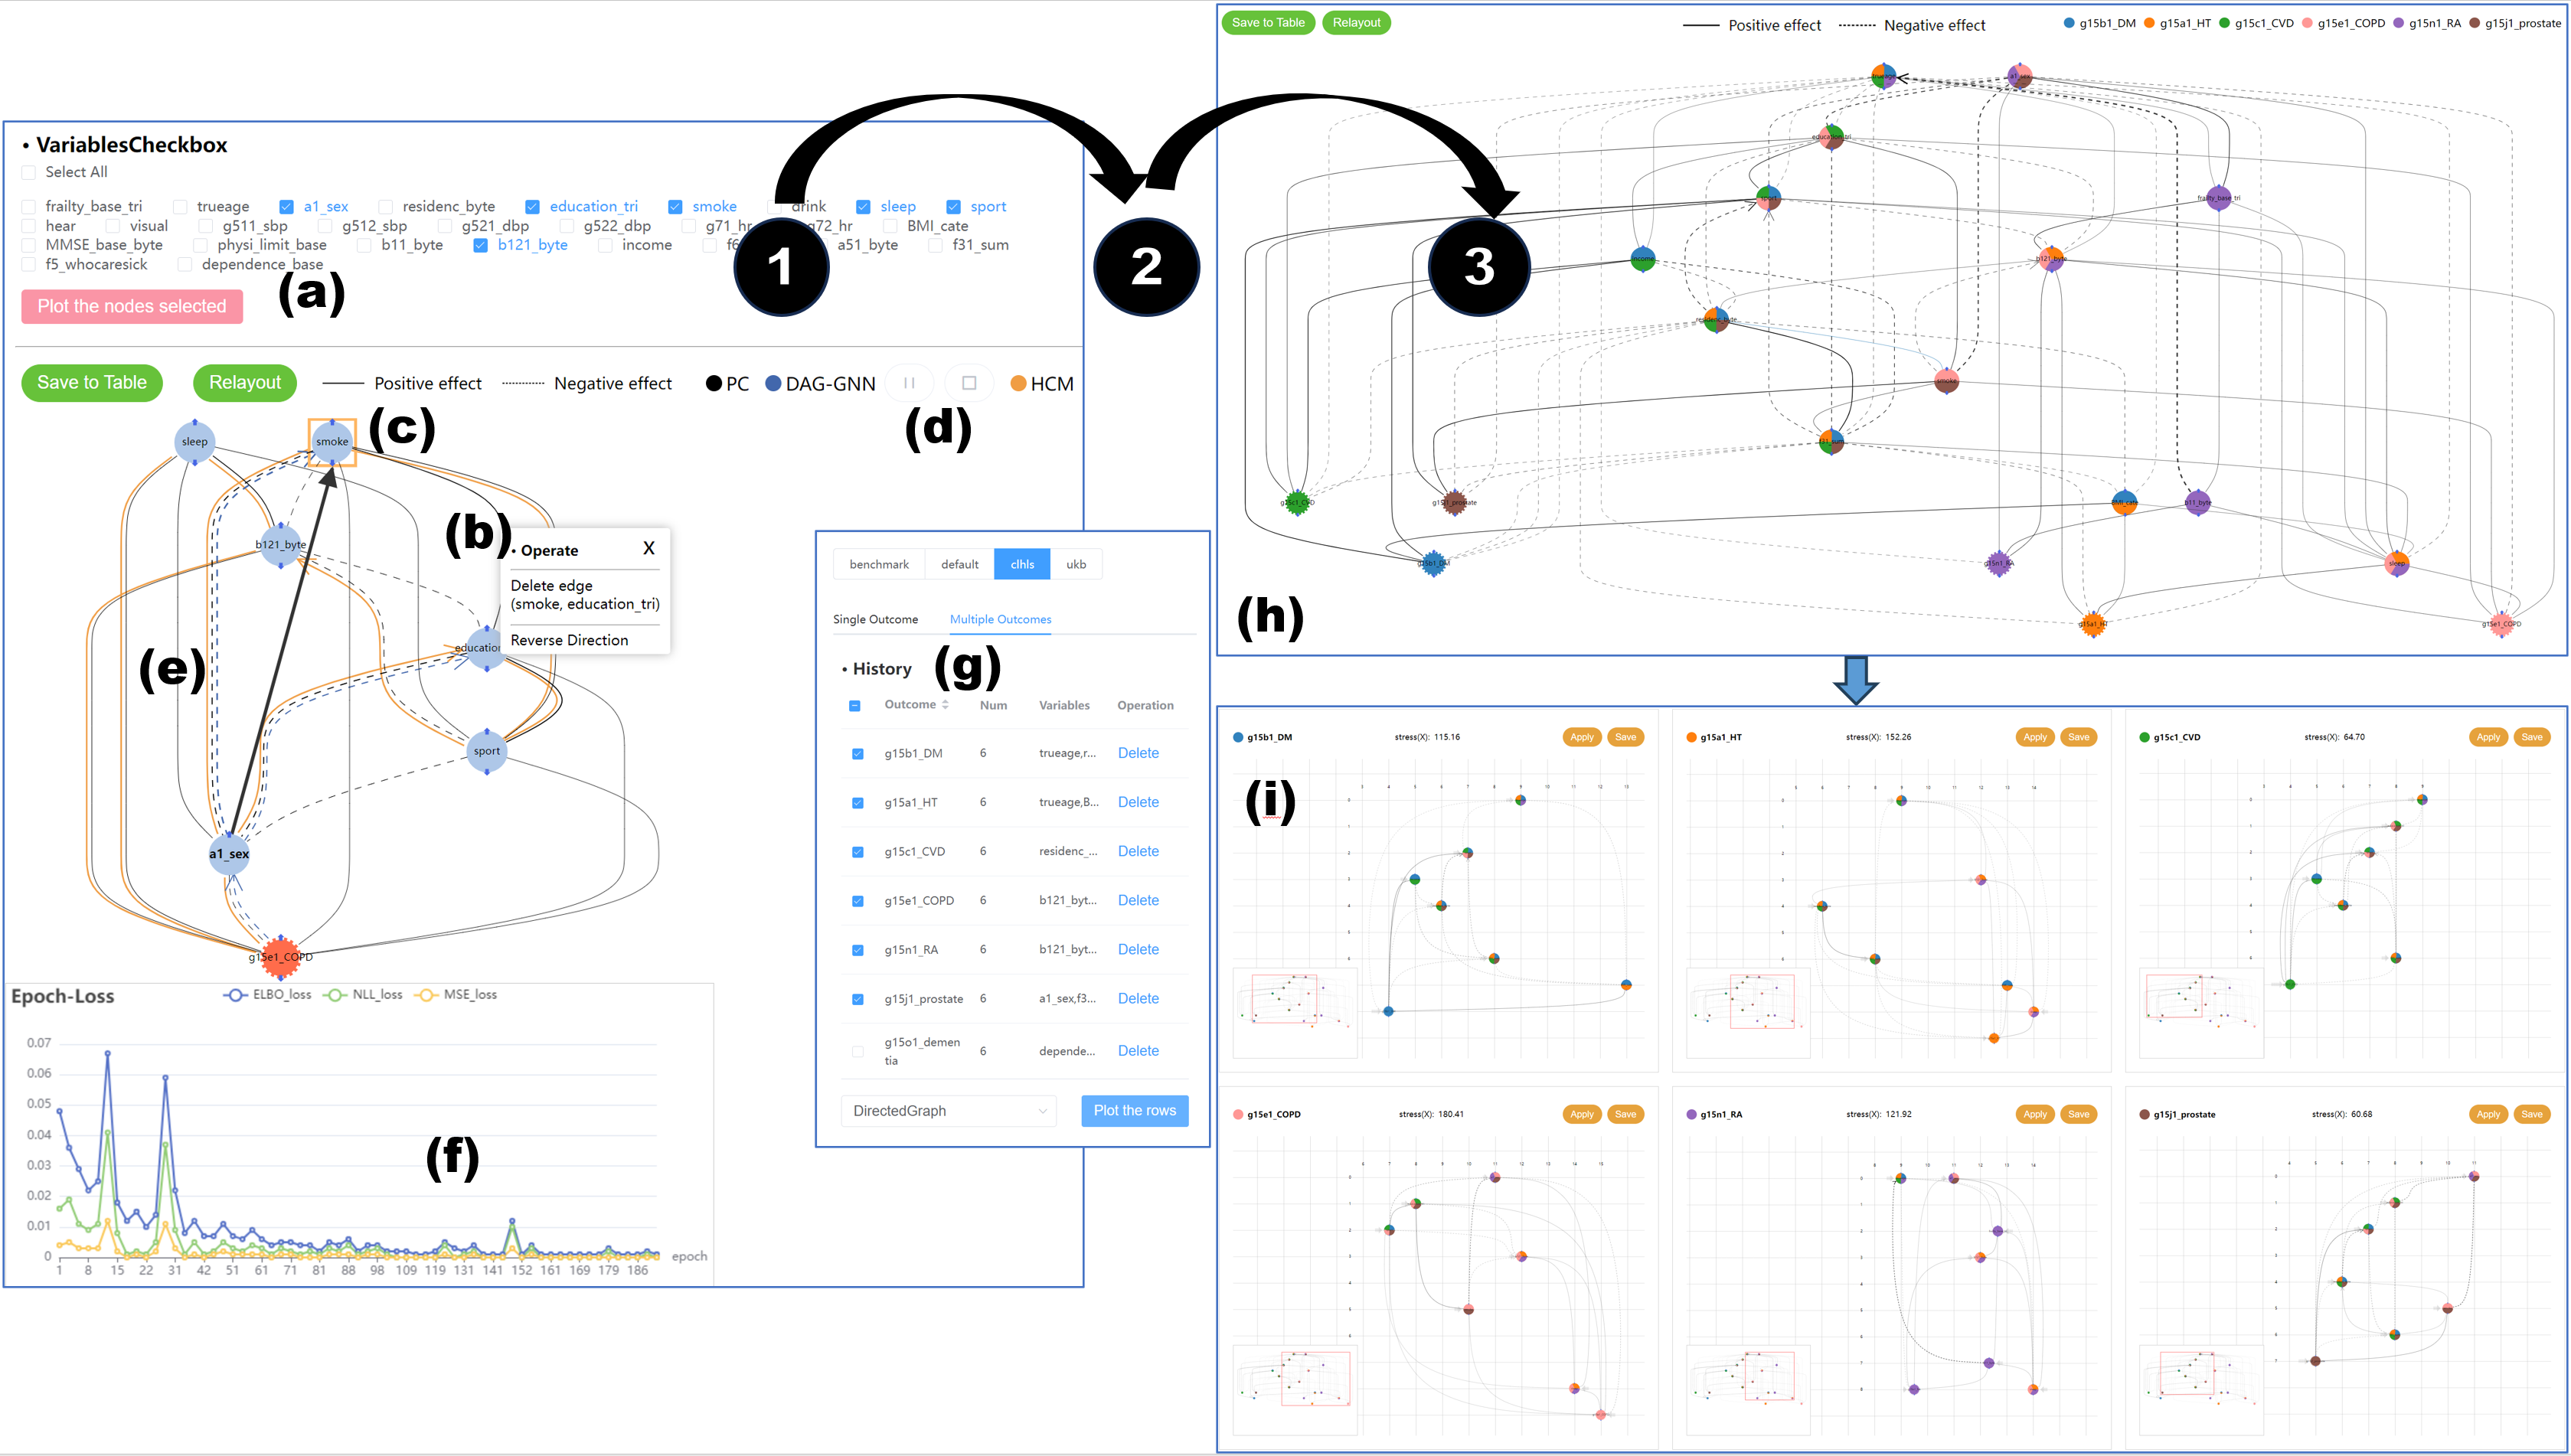
We introduce a visual analysis method for multiple causal graphs with different outcome variables, namely, multi-outcome causal graphs. Multi-outcome causal graphs are important in healthcare for understanding multimorbidity and comorbidity. To support the visual analysis, we collaborated with medical experts to devise two comparative visualization techniques at different stages of the analysis process. First, a progressive visualization method is proposed for comparing multiple state-of-the-art causal discovery algorithms. The method can handle mixed-type datasets comprising both continuous and categorical variables and assist in the creation of a fine-tuned causal graph of a single outcome. Second, a comparative graph layout technique and specialized visual encodings are devised for the quick comparison of multiple causal graphs. In our visual analysis approach, analysts start by building individual causal graphs for each outcome variable, and then, multi-outcome causal graphs are generated and visualized with our comparative technique for analyzing differences and commonalities of these causal graphs. Evaluation includes quantitative measurements on benchmark datasets, a case study with a medical expert, and expert user studies with real-world health research data.
@ARTICLE{Fan2024,
author={Fan, Mengjie and Yu, Jinlu and Weiskopf, Daniel and Cao, Nan and Wang, Huai-Yu and Zhou, Liang},
journal={IEEE Transactions on Visualization and Computer Graphics},
title={Visual Analysis of Multi-outcome Causal Graphs},
year={2024},
volume={},
number={},
pages={1-11},
keywords={Visualization;Data visualization;Layout;Cause effect analysis;Medical diagnostic imaging;Diseases;Cognition;Causal graph visualization and visual analysis;causal discovery;comparative visualization;visual analysis in medicine},
doi={10.1109/TVCG.2024.3456346}}