< Back to Home

Continuous Indexed Points for Multivariate Volume Visualization


Computational Visual Media

*Corresponding author

Abstract

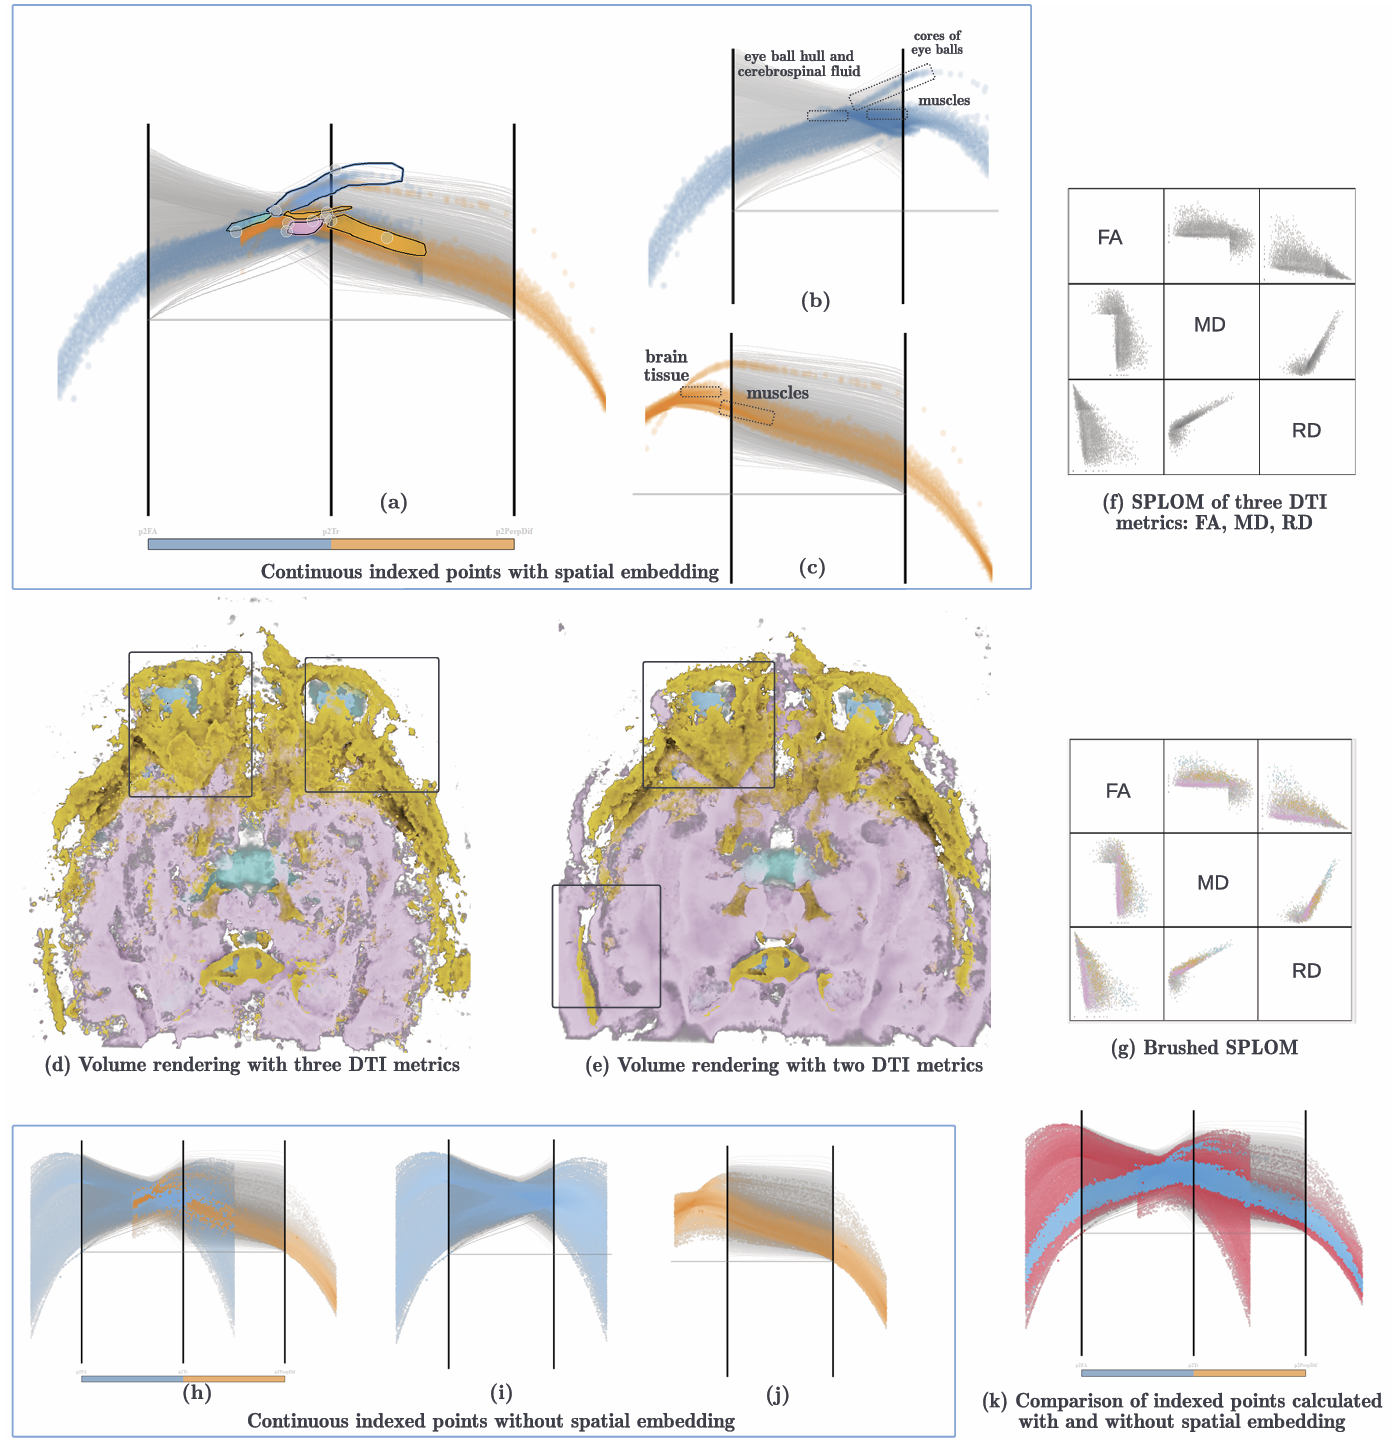
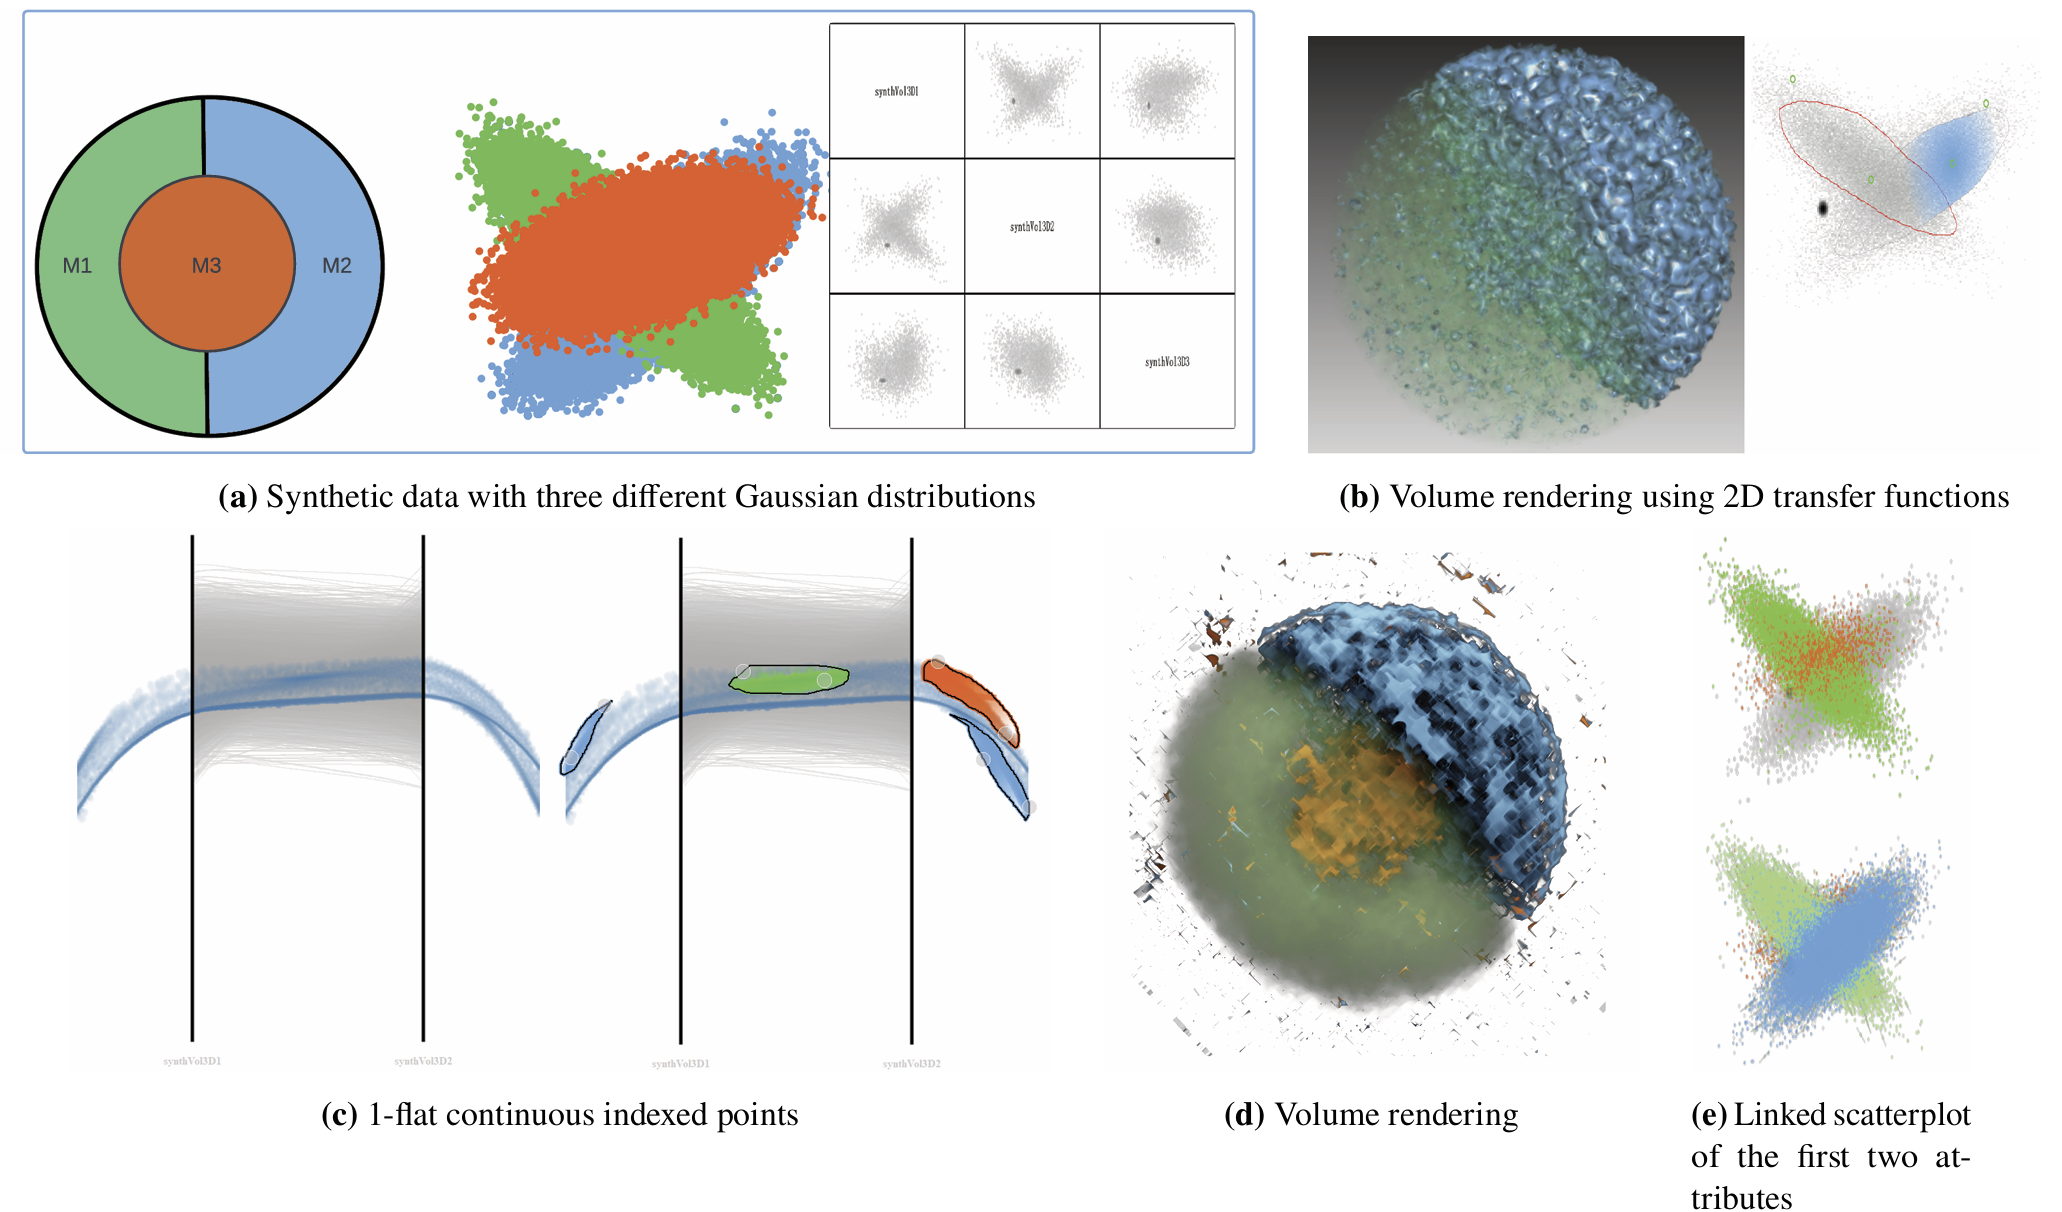
We introduce continuous indexed points for improved multivariate volume visualization. Indexed points represent linear structures in parallel coordinates and can be used to encode local correlation of multivariate (including multi-field, multifaceted, and multi-attribute) volume data. First, we perform local linear fitting in the spatial neighborhood of each volume sample using principal component analysis, accelerated by hierarchical spatial data structures. This local linear information is then visualized as continuous indexed points in parallel coordinates: a density representation of indexed points in a continuous domain. With our new method, multivariate volume data can be analyzed using eigenvector information from local spatial embeddings. We utilize both 1-flat and 2-flat indexed points, allowing us to identify correlations between two variables and even three variables, respectively. An interactive occlusion shading model facilitates good spatial perception of the volume rendering of volumetric correlation characteristics. Interactive exploration is supported by specifically designed multivariate transfer function widgets working in the image plane of parallel coordinates. We show that our generic technique works for multi-attribute datasets. The effectiveness and usefulness of our new method is demonstrated through a case study, an expert user study, and domain expert feedback.

BibTeX

@ARTICLE{Zhou2025cvm,
      author={Zhou, Liang and Gou, Xinyi and Weiskopf, Daniel},
      journal={Computational Visual Media}, 
      title={Continuous indexed points for multivariate volume visualization}, 
      year={2025},
      volume={},
      number={},
      pages={1-26},
      keywords={Data visualization;Correlation;Transfer functions;Visualization;Rendering (computer graphics);Mathematical models;Three-dimensional displays;Solid modeling;Fitting;Diffusion tensor imaging;volume visualization;multivariate volumes;multi-field;correlation;indexed points;parallel coordinates},
      doi={10.26599/CVM.2025.9450496}}